📄 Page Speed Checker
Check page speed, page size, and requests. Get clear insights and fixes instantly.
How to use
Last updated: 8 months ago
Step-by-Step Guide to Using the Page Speed Checker
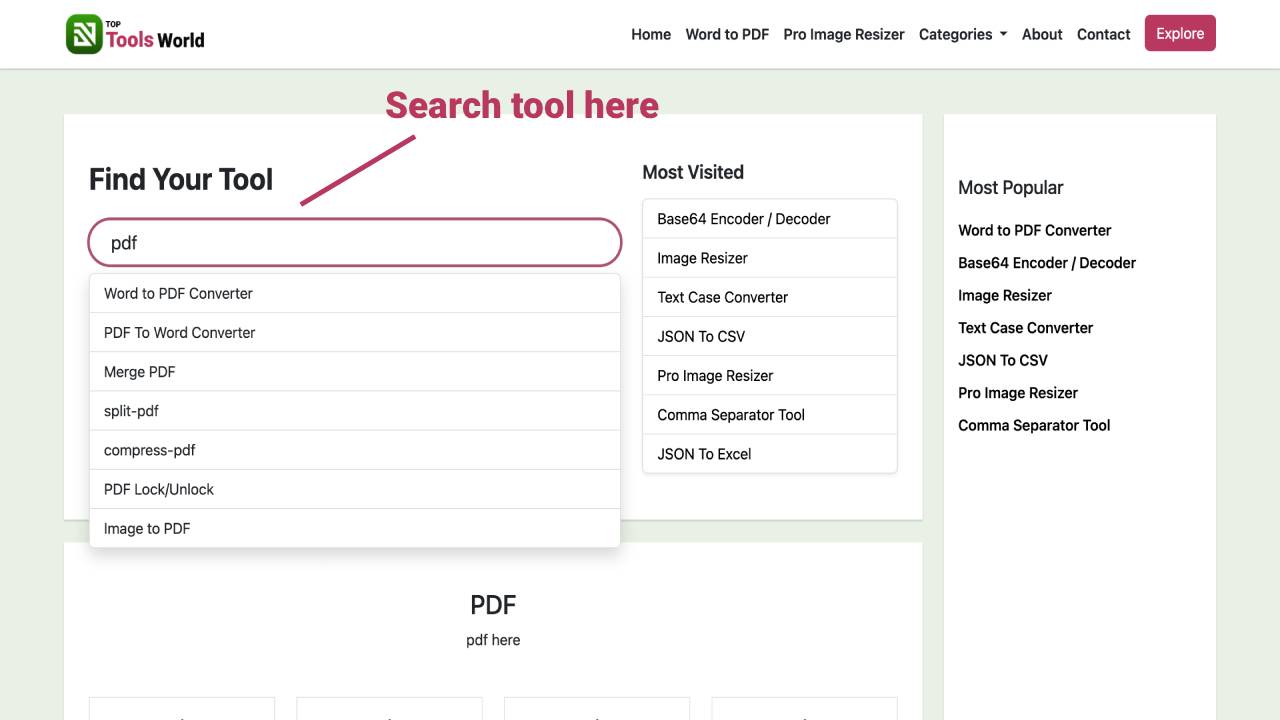
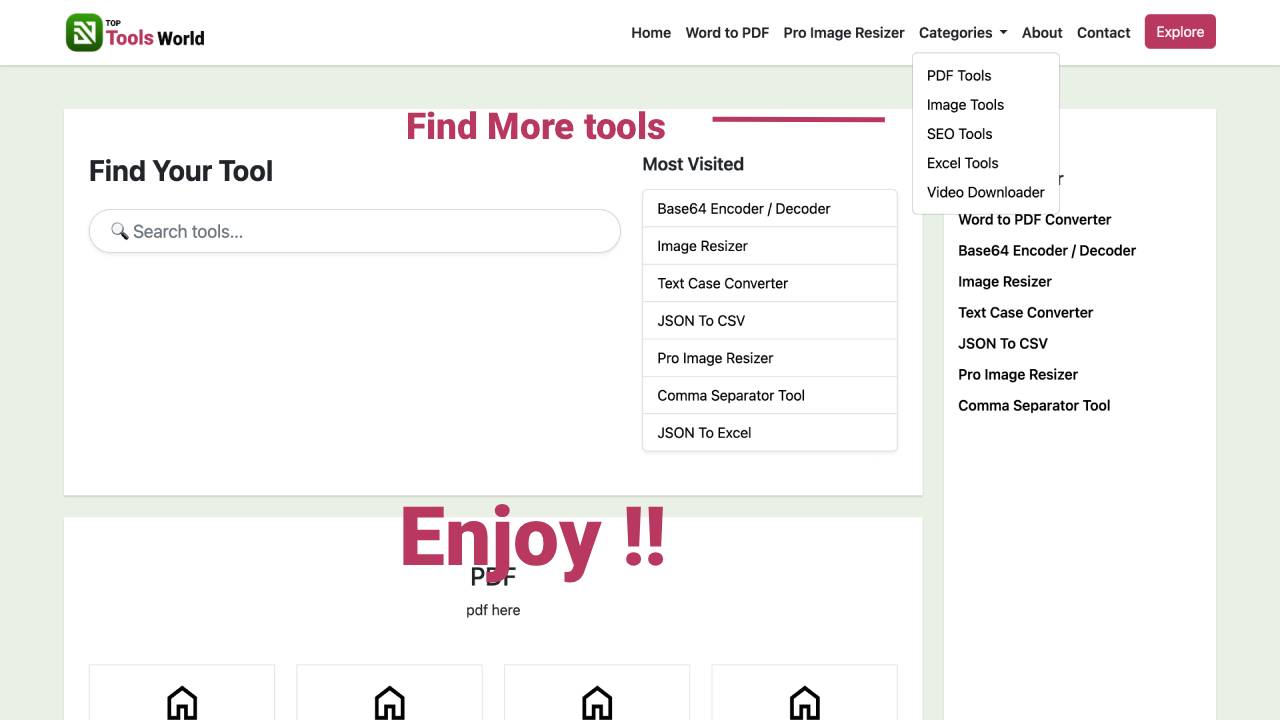
- Open the Page Speed Checker on Top Tools World. You’ll see a clean, distraction-free layout designed to get you from analysis to insights in seconds.
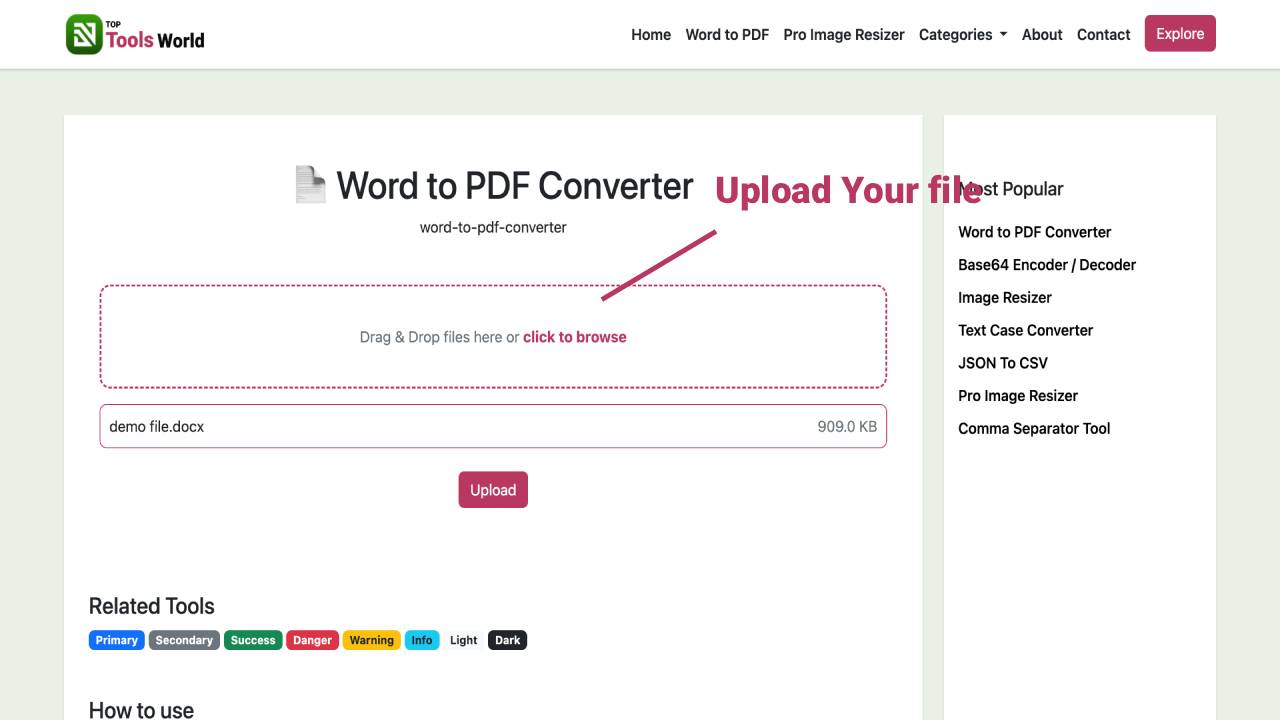
- Type your website address. Use your main domain or a full page URL that you want to analyze (homepage, blog post, product page, or landing page).
- Start the analysis by tapping the main action button. The test begins immediately and you’ll see a simple progress indicator while the scan runs.
- View the Performance Overview first. This top section summarizes your Performance Grade, Page Size, Load Time, and Total Requests so you know exactly where you stand at a glance.
- Check Response Codes to spot issues fast. Success, redirects, client errors (like 404), or server errors (like 500) are grouped so you can quickly identify and fix broken paths or unnecessary redirects.
- Explore Content Size by Type. See how much of your page weight comes from images, scripts, styles, fonts, and other assets. This helps you target the biggest wins for optimization.
- Review Requests by Type and by Domain. Identify which types of files and which domains (your own or third-party services) are making the most requests. Reducing heavy or redundant requests is a quick way to improve speed.
- Open Slowest Resources. Here you’ll find a detailed list of URLs with timing breakdowns like DNS, SSL, Connect, Send, and Wait. Use this to pinpoint the exact elements causing delays.
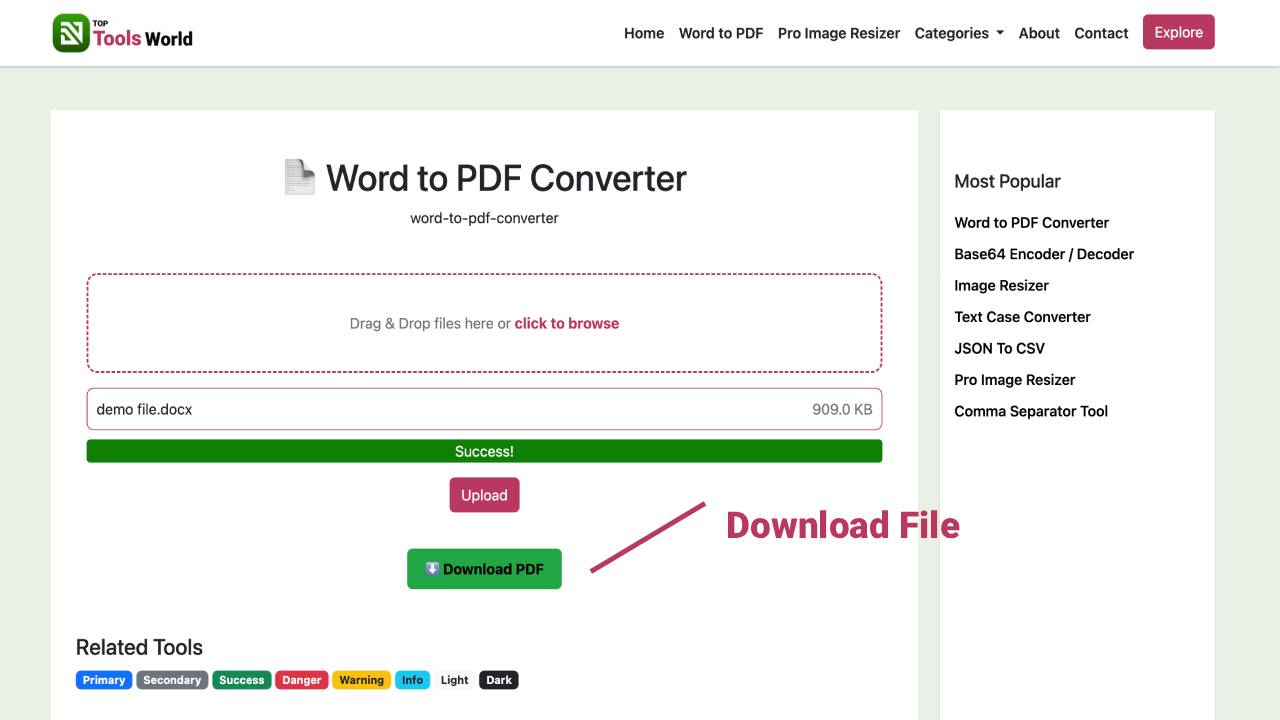
- Prioritize fixes. Tackle large images, render-blocking scripts, or slow third-party embeds first. Re-run the test on Top Tools World to confirm improvements and track your gains over time.
Key Benefits of Using Page Speed Checker on Top Tools World
- Effortless workflow: enter your URL, start the check, and get a clear, actionable report.
- Accuracy you can trust: data-rich insights on load time, page size, and request counts.
- Fast results: instant speed diagnostics so you can fix issues without delay.
- Reliability: consistent reporting across tests to measure progress confidently.
- Time-saving: highlights heavy assets and slow requests so you focus on what matters.
- Actionable breakdowns: by type and domain, making it simple to locate bottlenecks.
- Problem detection: response codes and slowest resources reveal broken links and server delays.
- Fits any scenario: perfect for audits, pre-launch checks, SEO improvements, or routine maintenance.
- Clarity for all users: intuitive language and structure, no technical jargon required.
- Backed by Top Tools World expertise: a trusted destination for practical, results-driven tools.
Why Choose Our Page Speed Checker? (Unique Advantages)
Top Tools World focuses on clear, comprehensive reporting that leads to action. Our Page Speed Checker presents the essentials up front—Performance Grade, Load Time, Page Size, and Total Requests—so you instantly understand your page’s condition. Then it dives deeper into the details that professionals need without overwhelming beginners.
What sets it apart is the precision of its breakdowns: response codes to catch errors, content size by type to find heavy assets, and requests by type and domain to expose unnecessary or redundant calls. The Slowest Resources table, with granular timing phases (DNS, SSL, Connect, Send, Wait), helps you diagnose exactly where delays occur—from network lookups to server handshakes and waiting time.
Users prefer Top Tools World because it balances depth and simplicity. You get powerful insights, presented in plain language, to make fast, confident decisions—no steep learning curve, no guesswork.
What is a Page Speed Checker? A Complete Overview
A Page Speed Checker measures how quickly a web page loads and why. It examines the elements that make up your page—HTML, images, CSS, JavaScript, fonts, third-party scripts—and reports how they impact performance. The goal is to show you which assets are heavy, which requests are slow, and where optimizations will have the biggest impact.
Why it matters: faster pages rank better in search, convert more visitors, and reduce bounce rates. When a page is slow, people leave. That’s lost revenue and lost visibility. Top Tools World’s Page Speed Checker helps you find the friction that keeps your audience waiting.
Common problems it solves include:
- Oversized images increasing page weight and delaying first render.
- Too many requests, especially from multiple third-party domains.
- Render-blocking CSS or JavaScript that slows the start of page rendering.
- Redirect chains that add extra round trips before content loads.
- Server or DNS delays causing long wait times even for small files.
- Broken links (4xx) and server errors (5xx) that disrupt the experience.
Example: Suppose your landing page loads in 4.8 seconds with a 3.5 MB page size and 120 requests. The tool might reveal that images account for 2.4 MB and that a set of third-party widgets makes 35 separate calls. By compressing images, lazy-loading below-the-fold media, and removing a redundant widget, you could cut the page size in half and reduce requests by 20–30, often dropping the load time by several seconds. With Top Tools World, those opportunities are easy to spot.
Advanced Tips & Best Practices
- Test key templates: analyze your homepage, top blog posts, product pages, and checkout or lead forms individually.
- Compare before and after: run a baseline test on Top Tools World, apply fixes, and retest to verify impact.
- Target the biggest wins: use Content Size by Type to compress images (WebP/AVIF), minify CSS/JS, and remove unused code.
- Reduce third-party drag: Requests by Domain reveals heavy external services. Remove or defer low-value scripts and consider local hosting where possible.
- Speed up the critical path: inline or preload critical CSS, defer non-essential JavaScript, and preload key fonts to improve early rendering.
- Optimize connections: use HTTP/2 or HTTP/3 where available, enable keep-alive, and apply CDN caching for global delivery.
- Fix response code issues: eliminate 404s and minimize 301 chains to avoid extra latency.
- Tame fonts: subset and compress webfonts, use font-display: swap, and limit variant weights.
- Leverage caching: set proper cache headers for static assets to reduce repeat-load times.
- Monitor slowest resources: check DNS/SSL/Connect/Wait phases to decide whether to move assets to a faster host or CDN.
- Make performance routine: schedule regular checks with Top Tools World, especially after content updates or new plugin installs.
FAQs About the Page Speed Checker
- How accurate are the results? The tool provides consistent, data-driven measurements of load time, page size, and requests, with detailed breakdowns to help you take action.
- What is a good page load time? Many sites aim for under 2–3 seconds. The lower the better, especially on mobile and slower networks.
- What’s the difference between page size and total requests? Page size is the total weight of all assets; total requests is how many separate files your page loads. Both affect speed.
- How do I use the Slowest Resources section? Look for URLs with long Wait or Connect times, large sizes, or repeated delays. Optimize, defer, or replace them, then retest on Top Tools World.
- How often should I test my site? Test after every major change and at least monthly to catch regressions early.
- Can this help SEO? Yes. Faster pages improve user experience and can positively influence search rankings and engagement.
- Does it work for any page? Yes. You can analyze homepages, product pages, blog articles, and even campaign landing pages with Top Tools World.
When you need trustworthy insights and practical guidance, Top Tools World’s Page Speed Checker delivers clarity, speed, and confidence—so you can optimize, retest, and win more visitors.